2026 A-Level H2 Economics Paper 1 suggested answers: Poland and Boeing vs Airbus case studies
By StudySzn · · 40 min read
The short answer: these are StudySzn's suggested answers to every part of the 2026 A-Level H2 Economics Paper 1 (9570/01), with diagrams and a "how marks are awarded" table for each part. They are our own model answers, not the official mark scheme. The big calls:
- 1(e): labour cost is important, but not the most important reason firms nearshore to Poland. Hungary and Romania have cheaper labour, yet the FDI goes to Poland. Closeness to EU markets wins.
- 1(f): FDI incentives are likely to cause a conflict between growth and price stability in the short run, but the conflict eases in the long run as LRAS rises.
- 2(c): both elastic and inelastic answers can score if you explain them. We recommend inelastic: cheaper planes cut fares across the whole market at once.
- 2(f): subsidising trains helps on domestic routes, but on its own it is not the most appropriate policy. A tax on flying, with the revenue funding trains, does more.
The extracts are omitted for copyright reasons, so have your copy of the paper next to you. To see which topics keep coming back across past papers, read which H2 Economics topics keep coming back.
The questions
Question 1: Poland's economic opportunities and challenges
1(a) Explain two possible reasons for Poland's relatively small forecast growth rate of GDP in 2023 compared to 2022. [4]
1(b) Explain two likely reasons why a growth in Poland's GDP per capita is inadequate to conclude that living standards have increased for all its citizens. [4]
1(c) Using a production possibility curve diagram, explain why Poland's economy benefits from migrants joining its labour market. [2]
1(d) Explain one reason for the change in Poland's government budget balance from 2021 to 2022 as shown in Table 1. [2]
1(e) Discuss whether labour cost is the most important consideration for profit-maximising firms to nearshore to Poland. [8]
1(f) Discuss whether Poland's government regulations to attract FDI would likely result in a conflict between macroeconomic objectives. [10]
[Total: 30]
Question 2: Economic problems in commercial aircraft manufacturing and passenger air travel
2(a) Explain why 'the market structure for commercial aircraft manufacturing is an oligopoly'. [2]
2(b) Using a diagram, explain why dominance by Boeing and Airbus in the manufacturing of commercial aircraft may cause allocative inefficiency. [4]
2(c) Using a demand and supply diagram, explain how greater competition in commercial aircraft manufacturing could affect the revenue of global airlines. [4]
2(d) Using the concept of opportunity cost, explain why it can be wrong for a government to assume that its 'investment in infrastructure such as an airport will be beneficial' (Extract 5). [2]
2(e) Discuss whether the increased growth of new airports is likely to only benefit the countries building these airports. [8]
2(f) Discuss whether 'subsidising alternative methods of transport that are more sustainable' is the most appropriate policy in tackling market failure associated with air passenger travel emissions. [10]
[Total: 30]
Extracts omitted for copyright reasons.
Suggested Answers: Question 1
Figures 1 and 2, Tables 1 and 2 and the extracts are in the question paper and are not reproduced here. The answer diagrams are numbered from Figure 3.
1(a)
Question: Explain two possible reasons for Poland's relatively small forecast growth rate of GDP in 2023 compared to 2022. [4]
Model Answer 1(a)
Figure 1 shows that GDP growth is forecast to fall from 4.87% in 2022 to only 0.32% in 2023.
Reason 1: Slower growth of investment (I).
- Table 1 shows that investment growth fell from 4.6% in 2022 to 1.2% in 2023. The war in Ukraine from February 2022 (Extract 2) made the future less certain, so firms expected lower returns and delayed investment projects. [1]
- Investment is a component of AD (AD = C + I + G + X - M). When I grows more slowly, AD rises by less. Firms receive fewer orders, so they raise output and hire workers by less. Through the multiplier, national income rises by much less, so real GDP growth falls. [1]
Reason 2: Imported cost-push inflation.
-
Extract 2 says the prices of electricity, coal and gas rose because supplies from Russia had to be sourced from elsewhere, and food prices rose 20% year on year. Table 1 shows CPI inflation of 14.4% in 2022 and 12.7% in 2023. [1]
-
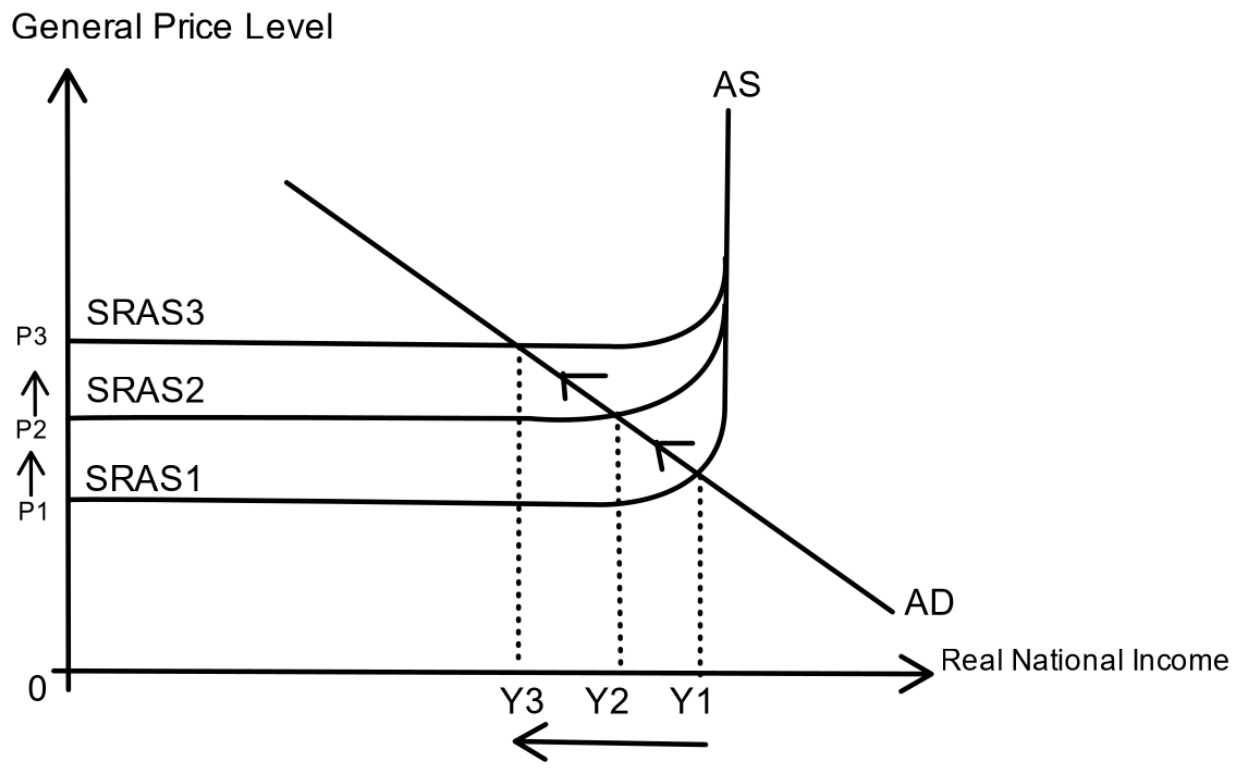
Energy is an input for almost every firm, so the unit cost of production rises. As shown in Figure 3 below, SRAS falls from SRAS1 to SRAS2 and then to SRAS3. Firms pass on the higher costs as higher prices, so the general price level (GPL) rises from P1 to P3. As the GPL rises, real national income (RNY) falls from Y1 to Y3 through three effects: [1]
- Real wealth effect: higher prices lower the real value of households' savings, so households feel poorer and spend less (C falls).
- Interest rate effect: at higher prices, households and firms need more money for their transactions, so the demand for money rises and interest rates rise. Borrowing costs more, so C and I fall.
- International substitution effect: Polish goods become more expensive relative to foreign goods, so exports fall and imports rise (X - M falls).
These falls in spending pull real GDP growth down in 2023.
A diagram is not needed to earn this mark. Figure 3 is shown to help you see the chain.
Figure 3: Imported cost-push inflation from a fall in SRAS
How marks are awarded for 1(a)
| Mark | What you need to do |
|---|---|
| [1] | Reason 1: quote the fall in investment growth (4.6% to 1.2%) and give a cause from the case (war, uncertainty). |
| [1] | Reason 1: explain that slower growth of I means AD rises less, so output and income grow less (multiplier). |
| [1] | Reason 2: quote the rise in energy and food prices (Extract 2) or the CPI figures (Table 1). |
| [1] | Reason 2: explain that higher costs reduce SRAS, so the GPL rises and RNY falls through the real wealth, interest rate and international substitution effects. A diagram is not required. |
Other accepted reasons, if linked to the case: slower growth of export markets in Europe due to the war, or high domestic inflation from skill shortages and strong wage growth reducing competitiveness. Data must be used for full marks.
1(b)
Question: Explain two likely reasons why a growth in Poland's GDP per capita is inadequate to conclude that living standards have increased for all its citizens. [4]
Model Answer 1(b)
Three reasons are given below. You only need two (choose any 2).
Reason 1: GDP per capita is an average, so it does not show how income is distributed.
- GDP per capita is total GDP divided by population. A rise in this average can happen even if most of the extra income goes to a small group, so it hides inequality. The question says "all its citizens", so the distribution matters. [1]
- In Poland, the price rises were mostly in essentials: electricity, coal, gas and food, which rose 20% year on year (Extract 2). Low-income households spend a larger share of their income on food and energy, so their real income falls by more than that of rich households. Many of the over 1.5 million Ukrainian migrants take low-skilled jobs (Extract 2), which are usually low-paid. So the material living standards of poorer groups may have fallen even while GDP per capita rose. A Gini coefficient would be needed to check this. [1]
Reason 2: The growth in GDP per capita may be nominal, not real.
- Extract 1 does not say whether the growth in GDP per capita is in nominal or real terms. Nominal GDP per capita is measured at current prices, so it rises when prices rise even if no more goods and services are produced. [1]
- Table 1 shows that the CPI rose 14.4% in 2022 and 12.7% in 2023. If nominal GDP per capita grew by less than 14.4% in 2022, real GDP per capita would have fallen. Citizens could buy fewer goods and services, so their material standard of living would have fallen. [1]
Reason 3: GDP per capita does not measure non-material living standards.
- Non-material living standards include leisure time, stress, health and the quality of the environment. GDP per capita measures only the output of goods and services, so it leaves these out. [1]
- Extract 2 reports skill shortages and strong wage growth in Poland. Firms that cannot find enough skilled workers may ask existing workers to work longer hours. Their incomes rise, but they have less leisure and more stress, so their non-material standard of living may fall even as GDP per capita rises. [1]
How marks are awarded for 1(b)
| Mark | What you need to do |
|---|---|
| [1] | Reason 1: GDP per capita is an average and hides the distribution of income. |
| [1] | Reason 1: link to the case (essentials rising in price hurt low-income households more; migrants in low-skilled jobs). |
| [1] | Reason 2: explain nominal vs real GDP per capita. |
| [1] | Reason 2: use CPI data (14.4% or 12.7%) to show real GDP per capita may fall. |
| [1] | Reason 3: explain that GDP per capita leaves out non-material living standards (leisure, stress, environment). |
| [1] | Reason 3: link to the case (skill shortages leading to longer hours and less leisure). |
Any two reasons earn the full 4 marks. Only the first two reasons written are marked.
1(c)
Question: Using a production possibility curve diagram, explain why Poland's economy benefits from migrants joining its labour market. [2]
Model Answer 1(c)
- Extract 2 says that many of the over 1.5 million Ukrainian migrants joined the labour market, taking low-skilled jobs not wanted by Polish workers. This raises the quantity of labour, a factor of production, and fills low-skilled jobs that Polish workers did not want, which frees Polish workers for higher-skilled work. [1]
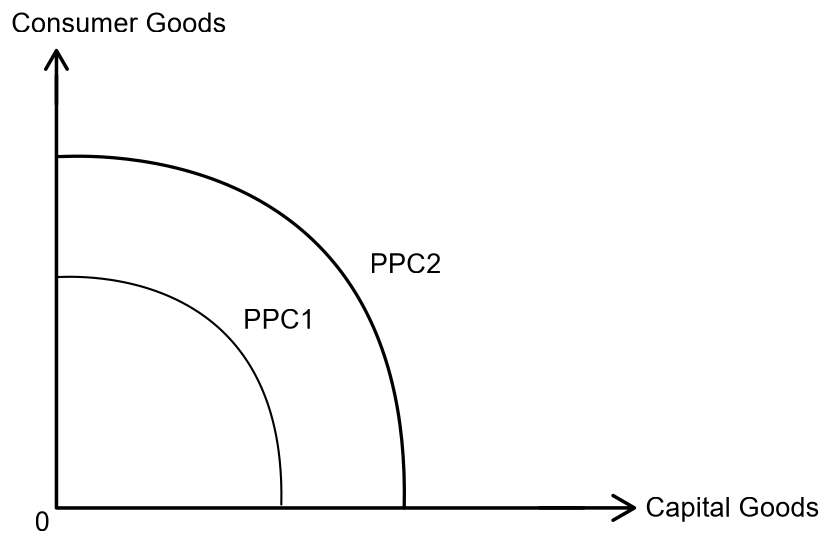
- With more labour, Poland's productive capacity rises. The PPC shifts outward from PPC1 to PPC2 in Figure 4 below, so Poland can now produce more of both capital goods and consumer goods. This is potential economic growth. [1]
Figure 4: Outward shift of the PPC (potential economic growth)
How marks are awarded for 1(c)
| Mark | What you need to do |
|---|---|
| [1] | Use the case: migrants raise the quantity of labour (a factor of production). |
| [1] | Correct PPC diagram with an outward shift, explained as a rise in productive capacity (potential growth). |
1(d)
Question: Explain one reason for the change in Poland's government budget balance from 2021 to 2022 as shown in Table 1. [2]
Model Answer 1(d)
- The government budget balance is tax revenue minus government spending (T - G). Table 1 shows that it went from -1.8% of GDP in 2021 to -3.5% of GDP in 2022, so the budget deficit widened. [1]
- One reason is a rise in government spending. Russia's war with Ukraine began in February 2022, and over 1.5 million migrants came to Poland. Extract 2 says supporting them "required an increasing amount of central government funding" for housing, healthcare and schools. G rose faster than T, so the deficit grew. [1]
How marks are awarded for 1(d)
| Mark | What you need to do |
|---|---|
| [1] | Define the budget balance as T - G and describe the change (deficit widened from 1.8% to 3.5% of GDP). |
| [1] | Explain one cause with case evidence (higher G to support Ukrainian migrants). |
1(e)
Question: Discuss whether labour cost is the most important consideration for profit-maximising firms to nearshore to Poland. [8]
Model Answer 1(e)
[Unpack Context] Nearshoring is when firms move part or all of their production to a country close to their main markets (Extract 3). Since 2021, many firms have moved production to Poland, and net FDI inflows have risen.
[Define Key Terms] Profit-maximising firms aim to make the largest possible profit, where profit = total revenue (TR) - total cost (TC). They produce the output where marginal cost equals marginal revenue (MC = MR), and MC is rising. So a firm decides where to produce by asking how the location changes both its costs and its revenue.
[Outline R1 & R2] This answer will first explain why labour cost is an important consideration, as it lowers costs. It will then explain why revenue, which depends on Poland's closeness to European markets, is also important.
R1: Labour cost is an important consideration, because low labour costs lower the firm's costs and raise its profit.
Figure 2 shows that Poland's hourly labour cost in 2023 was about €14.5. This is about a third of Germany's (about €41) and half of Italy's (about €30). Extract 3 adds that Poland has a skilled workforce, so the low wage does not come with low productivity.
Figure 5: Lower costs raising a firm's profits
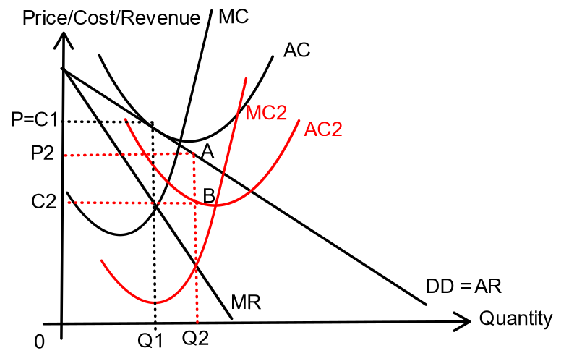
Labour is a variable cost. When a firm moves production from a high-wage country such as Germany to Poland, its variable costs fall. As shown in Figure 5 above, both MC and AC fall, to MC2 and AC2. The profit-maximising output, where MC = MR, rises from Q1 to Q2, and the price falls from P to P2. The firm was earning normal profit, since P = C1. Now it earns supernormal profit of area P2ABC2. A rational firm compares this rise in profit with the cost of moving, and nearshores if the gain is larger.
R2: However, revenue is another important consideration, because being close to European markets raises the demand for the firm's goods.
Extract 3 says that during the COVID-19 pandemic, delivery times for goods made in China shot up to 12 to 15 months. Firms that could not deliver lost orders. Poland is next to the European markets, has a developed infrastructure network, and gives access to the single EU market (Extract 1). So firms producing in Poland can deliver faster and more reliably to European buyers.
Figure 6: A rise in demand raising a firm's profits
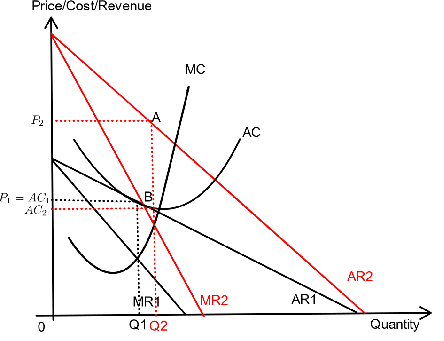
Buyers prefer suppliers that deliver quickly and reliably, so the demand for the firm's goods rises. As shown in Figure 6 above, AR rises from AR1 to AR2, and MR rises from MR1 to MR2. The profit-maximising output, where MC = MR and MC is rising, rises from Q1 to Q2, and the price rises from P1 to P2. TR rises to P2 x Q2. The firm was earning normal profit at P1 = AC1, and now earns supernormal profit of area P2ABAC2. So a location that protects sales can raise profit as much as a location that cuts costs.
Conclusion. Labour cost is important, but it is not the most important consideration. Figure 2 shows that Hungary (about €13) and Romania (about €11) have lower labour costs than Poland, yet Extract 3 reports a boost in net FDI inflows to Poland since 2021. If labour cost were the deciding factor, firms would go to Romania. Also, firms nearshoring out of China are moving to a country where labour costs more, not less. The defining reason in the case is geographical proximity to European markets. Extract 3 describes nearshoring as moving production "due to its geographical proximity to the European markets". Proximity works on both sides of profit. It raises revenue through faster, more reliable delivery, and it lowers delivery costs, a cost that soared to record levels during the pandemic. Labour cost then decides between countries that are already close to the market. Government regulations also tip the balance: Special Economic Zones cut tax rates and grants lower set-up costs (Extract 3), which raise after-tax profit. However, labour cost may matter more over time. Extract 3 notes "strong wage pressures" in Central Europe, so firms that came only for cheap labour may leave as wages rise. Firms that came for proximity and skills are more likely to stay.
How marks are awarded for 1(e)
This is an 8-mark question: 6 marks for analysis (R1 and R2) and 2 marks for evaluation (the conclusion).
| Paragraph | Analytical | Cursory | Knowledge |
|---|---|---|---|
| R1: labour cost (up to 3) | Uses Figure 2 data, explains that lower labour cost lowers MC and AC, and uses the MC = MR rule and a cost diagram to show higher profit. | States that labour is cheaper in Poland so profit rises, with no MC = MR analysis or diagram. | States that firms like low wages. |
| R2: revenue (up to 3) | Uses Extract 3 (delivery times, proximity, single market) to explain a rise in AR/MR, with a diagram showing higher profit. | Says firms want to be near customers, without linking to revenue or profit. | Lists other factors with no explanation. |
| Conclusion (2) | Clear stance on "most important" backed by evidence (e.g. Hungary and Romania are cheaper; nearshoring defined by proximity; rising wage pressures). | A stance with weak support. | A summary with no stance. |
You will lose marks if you leave out the profit-maximising condition (MC = MR, MC rising). The question is about profit-maximising firms, so every factor must be linked to TR, TC or profit.
1(f)
Question: Discuss whether Poland's government regulations to attract FDI would likely result in a conflict between macroeconomic objectives. [10]
Model Answer 1(f)
[Unpack Context] Poland attracts FDI through Special Economic Zones that reduce tax rates on investors, and through government grants for important investments (Extract 3). Net FDI inflows have risen since 2021.
[Define Key Terms] Foreign direct investment (FDI) is investment by a foreign firm to set up or expand production in another country. The main macroeconomic objectives are sustained economic growth, low unemployment, price stability and a healthy balance of payments (BOP). A conflict happens when a policy helps one objective but harms another.
[Outline R1 & R2] This answer will first explain how FDI raises growth and employment but may cause demand-pull inflation, a conflict. It will then explain why the conflict may not happen, because Poland has some spare capacity and FDI also raises productive capacity.
R1: The regulations are likely to cause a conflict between growth and low unemployment on one side, and price stability on the other.
Lower tax rates raise the after-tax return on investment, and grants lower the cost of a project. So more foreign firms invest in Poland, and investment (I) rises. I is a component of AD, so AD rises.
Figure 7: Demand-pull inflation
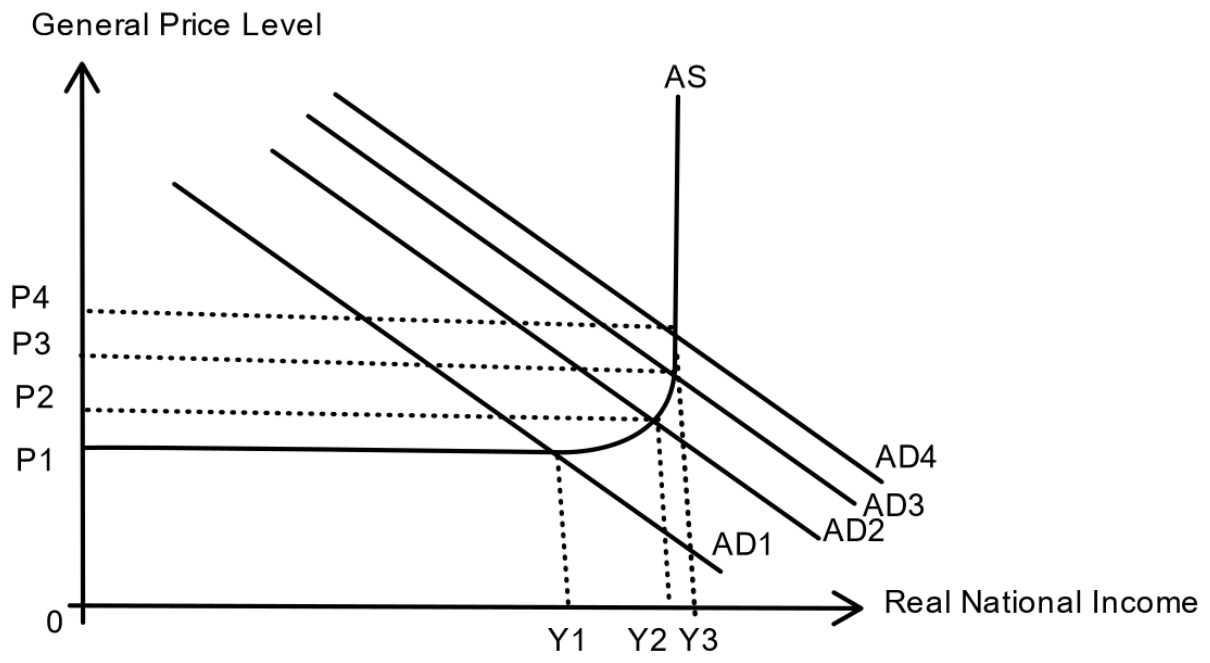
As shown in Figure 7 above, AD rises from AD1 to AD2. Firms face an unplanned fall in inventories, so they hire more workers and raise output. Real national income rises from Y1 to Y2, so there is actual growth and unemployment falls. However, Poland is near full employment. Unemployment was only 2.9% in 2022 and 3.5% in 2023 (Table 1), and Extract 2 reports skill shortages and strong wage growth. As AD keeps rising to AD3 and AD4, firms must bid up wages to attract scarce workers, so the unit cost of production rises. Firms pass this on as higher prices, so the general price level rises from P1 to P4, while real income rises only to Y3. This is demand-pull inflation. With CPI inflation already at 14.4% in 2022 and 12.7% in 2023, more inflation harms price stability. So growth and low unemployment conflict with price stability.
Ev1: However, the extra inflation from FDI is likely to be small compared to Poland's main source of inflation.
Extract 2 says the main price rises were in electricity, coal, gas and food, because supplies from Russia had to be sourced elsewhere. This is imported cost-push inflation, and it does not come from FDI. Skill shortages and strong wage growth also played a part, and FDI would add to these, but they were not the main cause. Also, FDI projects are spread over several years, so the rise in AD each year is gradual. So FDI adds only a little to inflation, and the conflict is mild.
R2: The regulations may not cause a conflict, because Poland has spare capacity and FDI also raises productive capacity.
First, spare capacity is growing. GDP growth is forecast to slow to 0.32% in 2023 (Figure 1), unemployment rose to 3.5% in 2023 and is forecast to reach 3.8% in 2024 (Table 1), and investment growth fell to 1.2% in 2023. The 1.5 million migrants who joined the labour market (Extract 2) add to the supply of labour, filling low-skilled jobs so that Polish workers can move to higher-skilled work. With spare capacity, firms can hire idle workers without bidding up wages much, so a rise in AD raises output with little inflation.
Second, FDI raises long-run aggregate supply. Foreign firms build new factories and bring new machinery and technology, so the capital stock and labour productivity rise.
Figure 8: Sustained economic growth from a rise in both AD and AS
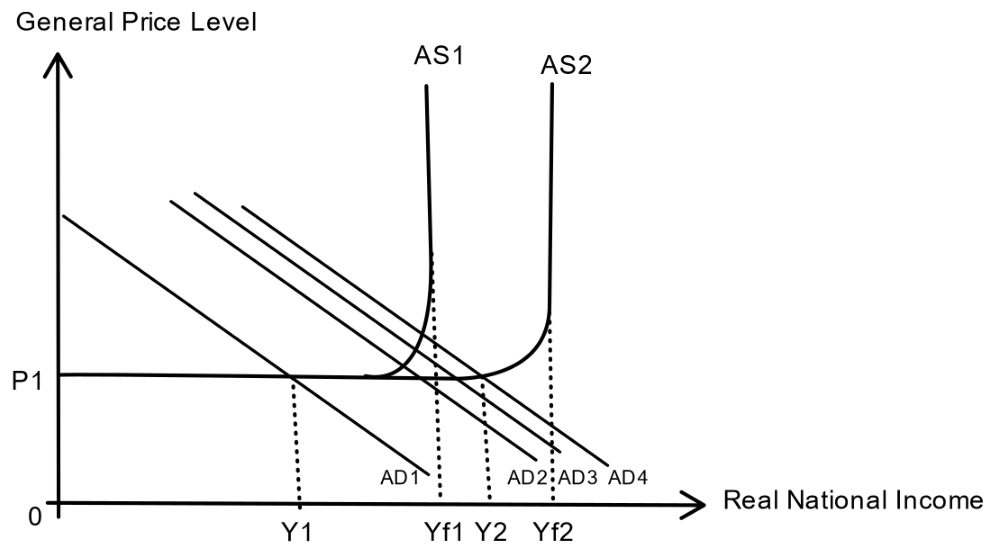
As shown in Figure 8 above, FDI raises AD from AD1 to AD4 through investment and the multiplier. At the same time, the extra capital raises productive capacity from Yf1 to Yf2, so AS rises from AS1 to AS2. Real national income rises from Y1 to Y2, while the general price level stays at P1. So Poland achieves actual and potential growth without inflation, which is sustained economic growth.
FDI can also help the BOP. Nearshoring firms produce in Poland to sell to European markets (Extract 3), so Poland's exports rise and the current account improves. The FDI inflow itself is recorded in the financial account. So FDI can help growth, employment, price stability and the BOP together.
Ev2: However, these benefits take time and may be smaller than expected.
New factories take years to build, so AD rises first and LRAS rises later. In the short run, the inflation risk in R1 remains. Nearshoring firms may import components and machinery, which raises imports, and they send profits back to their home countries, which worsens the primary income account. Lower tax rates and grants also cost the government money, at a time when the budget deficit was already 4.9% of GDP in 2023 (Table 1).
Conclusion. In the short run, the regulations are likely to cause a conflict between growth and price stability. In 2022 and 2023, Poland had unemployment around 3%, skill shortages and double-digit inflation (14.4% and 12.7%), so extra demand from FDI would push prices up further. The conflict is likely to ease over time. By 2024, inflation is forecast to fall to 4.6% and unemployment to rise to 3.8% (Table 1), so there is more spare capacity, and the Ukrainian migrants raise the supply of labour. As FDI projects are completed, LRAS rises, so growth becomes sustained. The size of the conflict depends on the type of FDI the government attracts. Investment in new technology and in export-oriented nearshoring raises capacity and exports, and is least likely to cause a conflict.
How marks are awarded for 1(f)
This is a 10-mark question: 7 marks for analysis (R1 and R2) and 3 marks for evaluation (Ev1, Ev2 and the conclusion).
| Paragraph | Analytical | Cursory | Knowledge |
|---|---|---|---|
| R1: conflict (up to 4) | Links lower tax rates and grants to higher I and AD, explains actual growth and lower unemployment, then demand-pull inflation near full employment with a diagram and Table 1 / Extract 2 evidence (low unemployment, skill shortages, high CPI). | Explains AD rising and inflation, without case evidence or diagram. | States that FDI causes inflation. |
| R2: no conflict (up to 3) | Uses spare capacity evidence (growth 0.32%, unemployment rising, migrants) and explains FDI raising LRAS, with a diagram showing growth without inflation. May add the BOP gain from exports. | Says FDI raises LRAS with no chain or evidence. | States that FDI is good for growth. |
| Ev1 and Ev2 (up to 2) | Judges the size or timing of each effect (inflation is mainly imported cost-push; LRAS gains lag; imports and profit repatriation). | Generic limits. | None. |
| Conclusion (1) | A clear stance on "likely", with time frame (short run vs long run) and case evidence. | A stance with weak support. | A summary with no stance. |
You will lose marks if you explain FDI without first linking it to the regulations in the question (lower tax rates in Special Economic Zones, grants).
Suggested Answers: Question 2
2(a)
Question: Explain why 'the market structure for commercial aircraft manufacturing is an oligopoly'. [2]
Model Answer 2(a)
- An oligopoly is a market dominated by a few large firms. In 2023, Boeing had just below 40% of the global market and Airbus over 59% (Extract 4), so the two-firm concentration ratio is about 99%. Barriers to entry are high: production is hugely complex and highly regulated, Embraer has not tried to compete, and COMAC is a decade or two away from being a strong competitor. [1]
- Because there are only two dominant firms, their decisions are mutually interdependent. Each firm must consider how the other will react. For example, Airbus is winning market share with fuel-efficient, mid-size aircraft (Extract 4), so Boeing must respond with its own fuel-efficient planes or keep losing customers. [1]
How marks are awarded for 2(a)
| Mark | What you need to do |
|---|---|
| [1] | Quote the market shares (about 40% + 59%, a two-firm concentration ratio of about 99%) to show a few dominant firms, or high barriers to entry with evidence. |
| [1] | Explain mutual interdependence (each firm's decision depends on the rival's reaction), ideally with a case example. |
2(b)
Question: Using a diagram, explain why dominance by Boeing and Airbus in the manufacturing of commercial aircraft may cause allocative inefficiency. [4]
Model Answer 2(b)
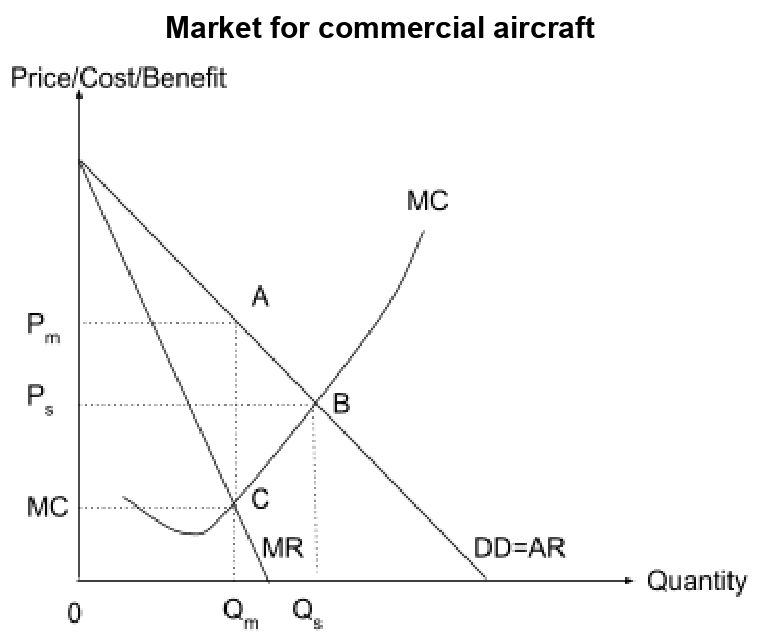
- Allocative efficiency is achieved when society produces the quantity of a good that maximises social welfare. This happens when price equals marginal cost (P = MC), since price shows the value consumers place on the last unit. In Figure 9 below, this is output Qs at price Ps. [1]
- Boeing and Airbus have market dominance, with about 99% of the market between them (Extract 4) and high barriers to entry, so they face a downward-sloping demand curve and can set prices. A profit-maximising firm produces where MC = MR, at Qm, and charges Pm. [1]
- At Qm, Pm is greater than MC. Each extra aircraft between Qm and Qs is worth more to buyers than it costs to make, but it is not produced. So aircraft are underproduced and overpriced. Extract 4 shows that buyers want more aircraft than are being made: an aircraft ordered from Airbus today may not arrive until the end of the decade, airlines must keep flying older, less fuel-efficient planes, and COMAC has taken more than 1000 orders. Complex production is part of the reason, but with so little competition, the two firms face little pressure to raise output or cut prices. [1]
- This creates a deadweight loss of area ABC in Figure 9, the extra welfare society could have gained if output were Qs. This is allocative inefficiency, a form of market failure. The dominance is likely to last, since Embraer has made no moves to compete and COMAC is a decade or two away (Extract 4), so there is little pressure to cut prices or raise output. [1]
Figure 9: Allocative inefficiency due to market dominance in the market for commercial aircraft
How marks are awarded for 2(b)
| Mark | What you need to do |
|---|---|
| [1] | Define allocative efficiency as P = MC (output Qs, price Ps). |
| [1] | Explain market dominance with case evidence (shares, barriers) and the profit-maximising output at MC = MR (Qm, Pm). |
| [1] | Show P > MC at Qm, so output is too low, ideally with case evidence of underproduction (long waits for aircraft, airlines flying older planes). |
| [1] | Correct diagram with the deadweight loss (area ABC) identified. |
2(c)
Question: Using a demand and supply diagram, explain how greater competition in commercial aircraft manufacturing could affect the revenue of global airlines. [4]
Model Answer 2(c)
- Greater competition, for example from COMAC (Extract 4), means more aircraft are produced and manufacturers must compete on price and fuel efficiency. Airlines can buy new planes sooner and at lower prices, and replace older, less fuel-efficient planes that are "costly to operate and maintain" (Extract 4). So the airlines' cost of providing each flight falls. [1]
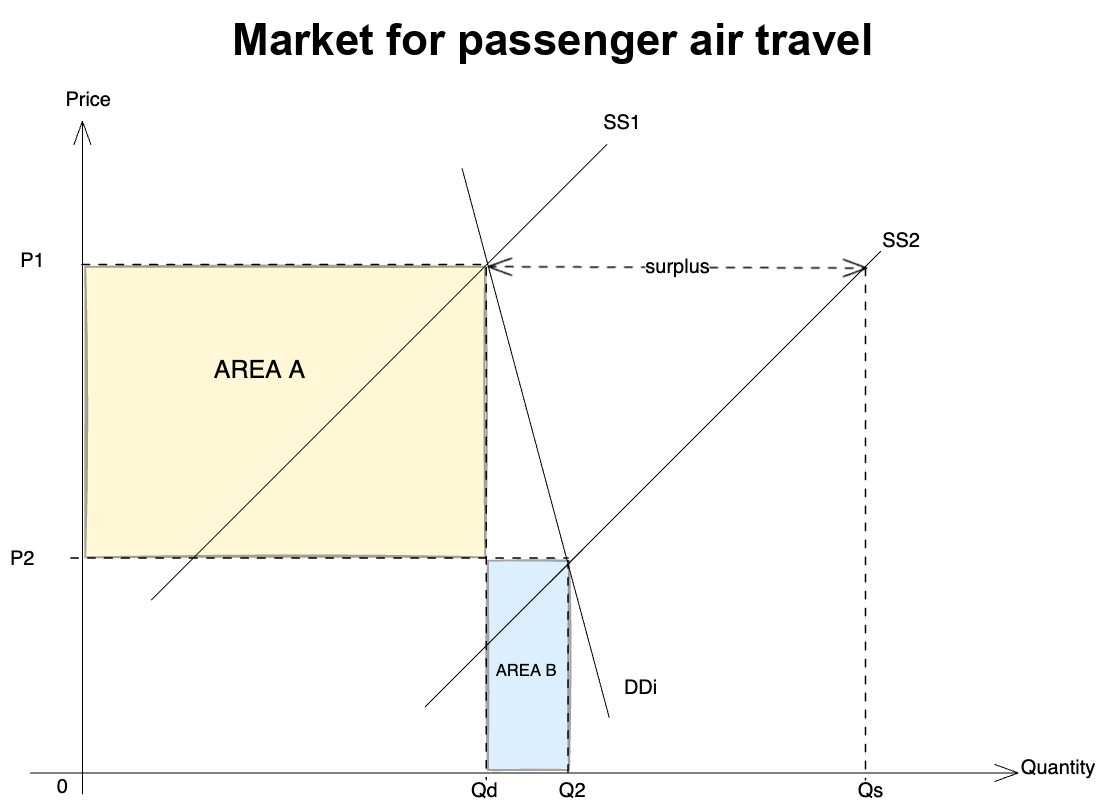
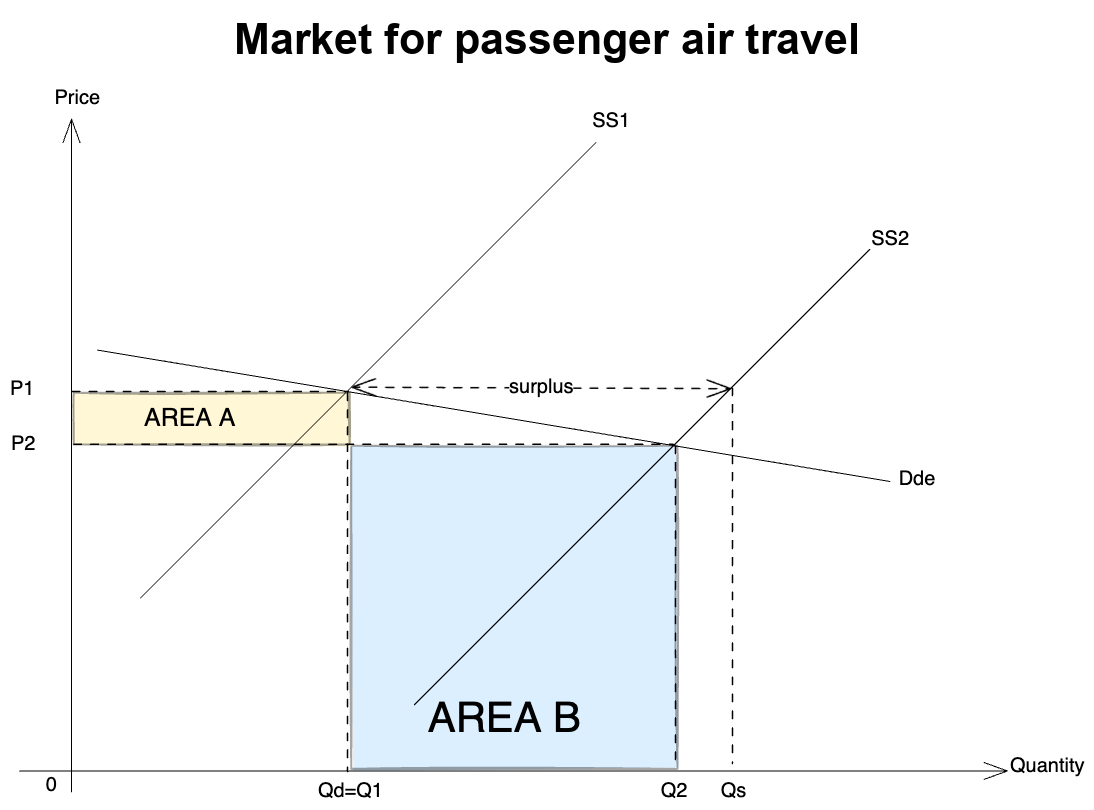
- In the market for passenger air travel, lower costs raise supply from SS1 to SS2. At the old price P1 there is a surplus, so the price of air travel falls from P1 to P2, and the quantity of air travel rises. [1]
- The effect on revenue depends on the price elasticity of demand (PED) for air travel. There are two valid answers. Choose one in the exam. Option A is recommended. [1]
Option A (recommended): demand for air travel is price inelastic (|PED| < 1), so total revenue falls.
- Greater competition among aircraft makers lowers costs for all airlines, so fares fall across the whole market. No airline wins passengers from another airline. People fly more only if they switch from other modes or travel more often, and for international and long-haul trips there are few substitutes. Business travellers also must travel whatever the fare. Extract 6 shows how hard it is to cut flying: the consumption of aviation fuel "shows little sign of falling". So a fall in price leads to a less than proportionate rise in quantity demanded, from Qd to Q2. [1]
- Total revenue (TR) = P x Q. As shown in Figure 10 below, airlines lose area A from the lower price and gain only area B from the higher quantity. Since area A is larger than area B, the total revenue of global airlines falls. [1]
Figure 10: A rise in supply with price inelastic demand, reducing total revenue
Why Option A is recommended: the question is about global airlines, so fares fall for the whole market at once. Studies of air travel demand for the International Air Transport Association (IATA, by InterVISTAS, 2007) estimate a PED of about 1.4 (elastic) for a single route, where passengers can switch to rival routes or airlines, but only about 0.8 (inelastic) for a whole national market.
Option B (also accepted): demand for air travel is price elastic (|PED| > 1), so total revenue rises.
- Much air travel is for leisure, which is not a necessity, and fares for long trips take a large share of income. Travellers can choose substitutes such as high-speed trains, nearer holiday destinations or online meetings (Extract 6), and low-cost airlines attract price-sensitive travellers. So a fall in price leads to a more than proportionate rise in quantity demanded, from Q1 to Q2. [1]
- As shown in Figure 11 below, airlines lose area A from the lower price but gain area B from the higher quantity. Since area B is larger than area A, the total revenue of global airlines rises. [1]
Figure 11: A rise in supply with price elastic demand, raising total revenue
How marks are awarded for 2(c)
| Mark | What you need to do |
|---|---|
| [1] | Link greater competition to lower costs for airlines (cheaper, more available, more fuel-efficient aircraft). |
| [1] | Show the rise in supply of air travel on a DD/SS diagram, with price falling and quantity rising. |
| [1] | Explain the PED of demand for air travel, with reasons (inelastic or elastic). |
| [1] | Conclude the effect on TR using areas A and B. |
Either PED answer earns full marks if it is explained, not just stated. Write only one. If you write both, the examiner marks the first.
2(d)
Question: Using the concept of opportunity cost, explain why it can be wrong for a government to assume that its 'investment in infrastructure such as an airport will be beneficial' (Extract 5). [2]
Model Answer 2(d)
- Opportunity cost is the value of the next best alternative forgone when a choice is made. Governments have limited funds, especially in low-income countries (Extract 5). The money spent on an airport, such as US$16 797 million for Long Thanh in Vietnam, cannot be spent on other things such as hospitals, schools or public transport. [1]
- An airport may give a positive net benefit, but the alternative forgone could have given an even higher net benefit to society. If so, building the airport is not the best use of resources, even if it is "beneficial". This is more likely when unintended consequences, such as higher emissions (Extract 6), lower the airport's true net benefit. [1]
How marks are awarded for 2(d)
| Mark | What you need to do |
|---|---|
| [1] | Define opportunity cost and name an alternative use of the funds, with case evidence (limited resources, size of investment). |
| [1] | Explain that the alternative may give a higher net benefit, so the airport may not be the best choice. |
2(e)
Question: Discuss whether the increased growth of new airports is likely to only benefit the countries building these airports. [8]
Model Answer 2(e)
[Unpack Context] Asia has 127 airport projects worth US$217 billion (Extract 5), such as Long Thanh in Vietnam and New Manila in the Philippines, while Singapore is building T5 to add 50 million travellers a year. International visitor arrivals across Asia are forecast to grow faster than anywhere else.
[Define Key Terms] The benefits of new airports are the gains to a country's macroeconomic objectives: actual and potential economic growth, more jobs and a stronger balance of payments.
[Outline R1 & R2] This answer will first explain how the countries building the airports benefit, and then explain how neighbouring countries also benefit.
R1: The countries building the airports benefit, through higher AD and higher productive capacity.
Building an airport is investment (I). For example, Vietnam is spending US$16 797 million on Long Thanh (Table 2). Once the airport opens, more international visitors arrive and spend on hotels, food and transport. Spending by foreign tourists counts as exports (X) of services. I and X are components of AD, so AD rises.
Figure 12: Rise in AD and AS from airport investment
As shown in Figure 12 above, AD rises from AD1 to AD4 through the multiplier. Firms hire more workers to build and run the airport and to serve tourists, so incomes rise and households spend more. Real national income rises from Y1 to Y2, so there is actual growth and unemployment falls. The airport also adds to the country's capital stock. Singapore's T5 adds 50 million travellers a year to capacity (Extract 5), so the economy can produce more air travel and tourism services. Productive capacity rises from Yf1 to Yf2, and AS rises from AS1 to AS2. So the general price level stays at P1, and the country enjoys sustained growth. Higher tourism exports also improve the current account.
R2: However, neighbouring countries also benefit, as tourists travel on to them.
Extract 5 says that T5 will be closer to the Tanah Merah Ferry Terminal, so travellers to Singapore can make "easier air-sea transfers to cruises and destinations in neighbouring countries". A tourist who flies into Singapore may then take a ferry to Indonesia's islands or join a cruise to Malaysia. Their spending in those countries counts as exports of services for the neighbouring country.
Figure 13: Rise in AD raising real national income through the multiplier
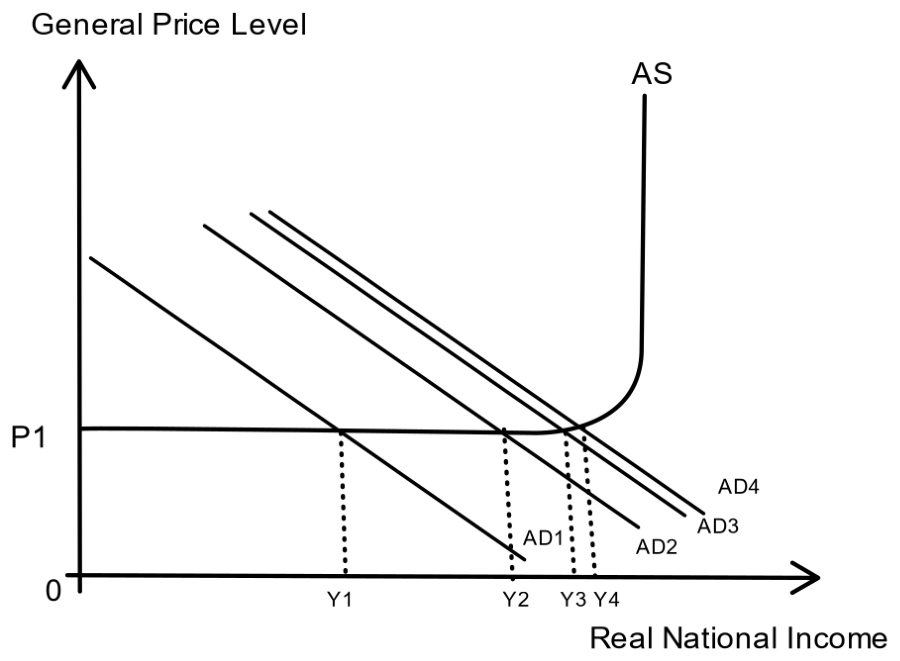
As shown in Figure 13 above, the rise in tourism exports raises the neighbour's AD from AD1 to AD2. Firms such as ferry operators and hotels face an unplanned fall in inventories, so they hire more workers and raise output. Households spend part of their higher income, so AD rises again through the multiplier, to AD4. With spare capacity, the price level stays at P1 and real national income rises from Y1 to Y4. Neighbours also gain because higher incomes in the building countries raise their spending on imports, which are the neighbours' exports. This is why Extract 5 expects airports to have "a major positive impact on economic growth in the region", not just in one country.
Conclusion. New airports are unlikely to benefit only the countries building them. Through air-sea transfers and higher regional incomes, neighbours gain too. However, the size of the benefit differs. The building country gains the most, because it gets the construction spending, the jobs and the extra capacity, while neighbours gain only from the tourists who travel on. The benefits are also not certain for anyone. The builders bear the cost and risk, and in low-income countries with limited funds (Extract 5), a poorly used airport can leave the government in debt. Neighbours may also lose if a new hub, such as T5, draws transit passengers away from their own airports. Finally, more flights mean more emissions (Extract 6), which harm every country through climate change. So new airports spread benefits across the region, but they also spread costs.
How marks are awarded for 2(e)
This is an 8-mark question: 6 marks for analysis (R1 and R2) and 2 marks for evaluation (the conclusion).
| Paragraph | Analytical | Cursory | Knowledge |
|---|---|---|---|
| R1: builders benefit (up to 3) | Explains higher I (construction) and X (tourism) raising AD and growth, and higher capacity raising AS, with a diagram and Table 2 / T5 evidence. | Says airports bring tourists and growth, with no AD/AS chain or diagram. | States that the builders benefit. |
| R2: neighbours benefit (up to 3) | Uses the air-sea transfer evidence and explains higher exports of services raising the neighbour's AD through the multiplier, with a diagram. | Says neighbours get more tourists, with no chain. | States that others benefit. |
| Conclusion (2) | Clear stance on "only", judging the different size of benefits and the costs (risk, debt, hub competition, emissions). | A stance with weak support. | A summary with no stance. |
2(f)
Question: Discuss whether 'subsidising alternative methods of transport that are more sustainable' is the most appropriate policy in tackling market failure associated with air passenger travel emissions. [10]
Model Answer 2(f)
[Unpack Context] Emissions from passenger air travel were about 3% of global CO2 emissions in 2023, and they are growing faster than emissions from any other mode of transport (Extract 6). Extract 6 suggests subsidising sustainable alternatives such as high-speed trains, as well as taxing air passengers, limiting flights per person and developing alternative fuels.
[Define Key Terms] Market failure occurs when the free market does not allocate resources efficiently, so society's welfare is not maximised. A negative externality is a spillover cost on third parties not involved in the transaction, for which no compensation is paid. A subsidy is a payment by the government to producers that lowers their cost of production.
[Outline R1 & R2] This answer will first explain the market failure. It will then explain how subsidising alternative transport can reduce it, and then compare it with taxes, quotas and cleaner technology.
R0: Market failure arises because passenger air travel creates a negative externality in consumption.
Figure 14: Negative externality in the consumption of passenger air travel
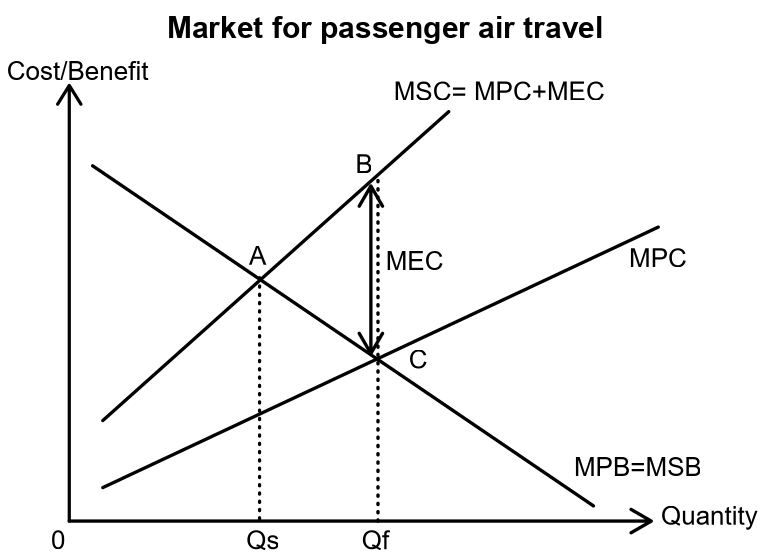
S: Source. In the market for passenger air travel, market failure occurs due to negative externalities in consumption.
A: Assumptions. We assume there are no positive externalities, so MPB = MSB.
D: Divergence. Rational passengers consider only their private benefit, the enjoyment of a holiday or a business meeting (MPB), and their private cost, the air fare (MPC). However, each flight burns aviation fuel and releases CO2, which adds to climate change. Third parties, such as people hit by floods and heatwaves, bear these costs and are not compensated. This is the marginal external cost (MEC). So the marginal social cost is MSC = MPC + MEC, and MSC lies above MPC.
S: Social optimum. Society's welfare is maximised at Qs, where MSB = MSC.
P: Private equilibrium. Passengers fly up to Qf, where MPB = MPC.
O/U: Overconsumption. Since Qf is greater than Qs, there is overconsumption of air travel.
T: Triangle. For each flight between Qs and Qf, the cost to society is greater than the benefit. This creates a deadweight loss of area ABC in Figure 14. Extract 6 shows that the problem is getting worse: fuel consumption "shows little sign of falling", and low-cost airlines are major contributors.
R1: Subsidising sustainable alternatives reduces the market failure, because passengers switch from flying to cheaper substitutes.
The government gives a subsidy to operators of high-speed trains for long-distance domestic travel (Extract 6). This lowers their cost of production.
Figure 15: Subsidy in the market for high-speed rail travel
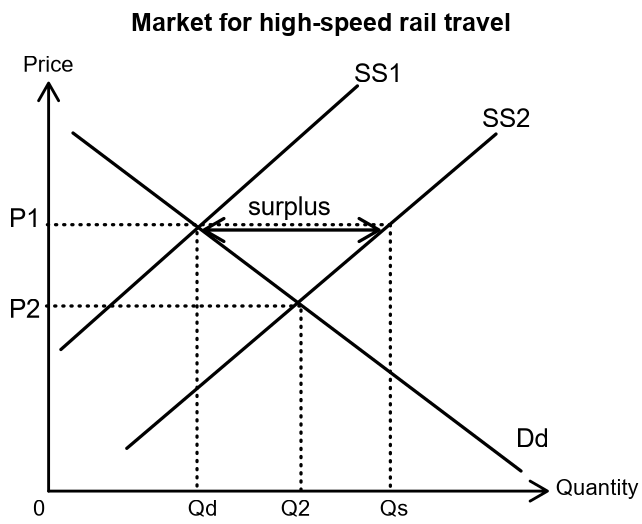
As shown in Figure 15 above, the supply of high-speed rail travel rises from SS1 to SS2. At the old price P1 there is a surplus, so the price of train tickets falls from P1 to P2, and the quantity of rail travel rises from Qd to Q2.
Trains and planes are substitutes, so the cross elasticity of demand between them is positive (XED > 0). When train fares fall, train travel becomes relatively cheaper, so rational travellers switch from flying to the train.
Figure 16: Fall in demand for air travel reducing the deadweight loss
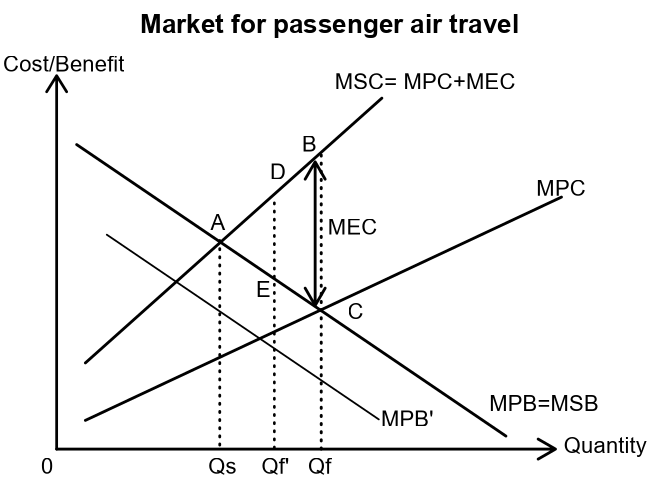
As shown in Figure 16 above, the demand for air travel (MPB) falls to MPB'. The quantity of air travel falls from Qf to Qf', closer to the social optimum Qs. Overconsumption falls, so the deadweight loss shrinks from area ABC to area ADE, and allocative efficiency improves. The policy is also popular, since it gives people a cheaper choice instead of punishing them, which matters when governments show "little enthusiasm" for radical change (Extract 6).
Ev1: However, subsidising alternatives works only where a close substitute exists, and it is costly.
High-speed trains replace only domestic, medium-distance flights. For long-haul and international flights, especially between island countries in Asia, there is no train substitute, so XED is close to zero and demand for flights hardly falls. A high-speed rail network also costs a lot to build and to subsidise each year. That money has an opportunity cost, which is high in low-income countries with limited funds (Extract 5). Finally, trains also cause some emissions, so total emissions fall by less than the fall in flights.
R2: Other policies may tackle the market failure more directly.
Three policies are shown below. In the exam you only need to explain one of them. Pick one, quote the Extract 6 evidence that suggests it, and adjust Ev2 and the conclusion to match.
(a) A tax on air passengers. Extract 6 says "taxing air passengers" has been suggested. The government can charge a tax per ticket equal to the MEC at Qs. Airlines pass the tax on as higher fares, so the private cost of flying rises.
Figure 17: A tax on air passengers internalising the external cost
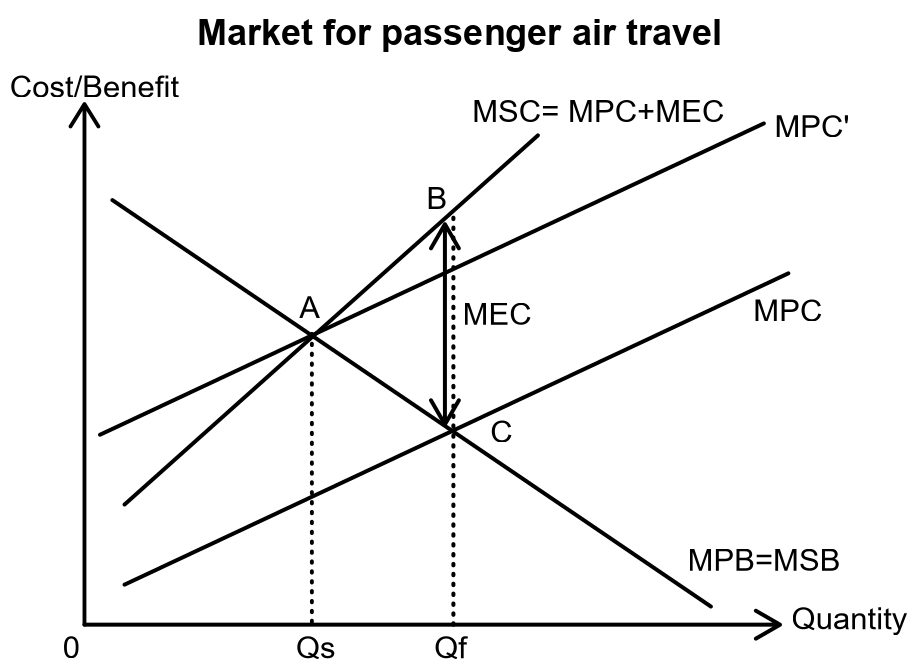
As shown in Figure 17 above, MPC rises to MPC'. Passengers now pay for the external cost they create, so the externality is internalised. The new equilibrium is at A, where MPC' = MPB, so the quantity falls from Qf to Qs and the deadweight loss of area ABC is removed. Unlike a subsidy, the tax applies to every flight, including long-haul flights with no substitute, and it raises revenue that can fund sustainable transport.
(b) Regulating the number of flights. Extract 6 says limiting the number of flights a person can take has been suggested. This is a quota.
Figure 18: A quota on air travel
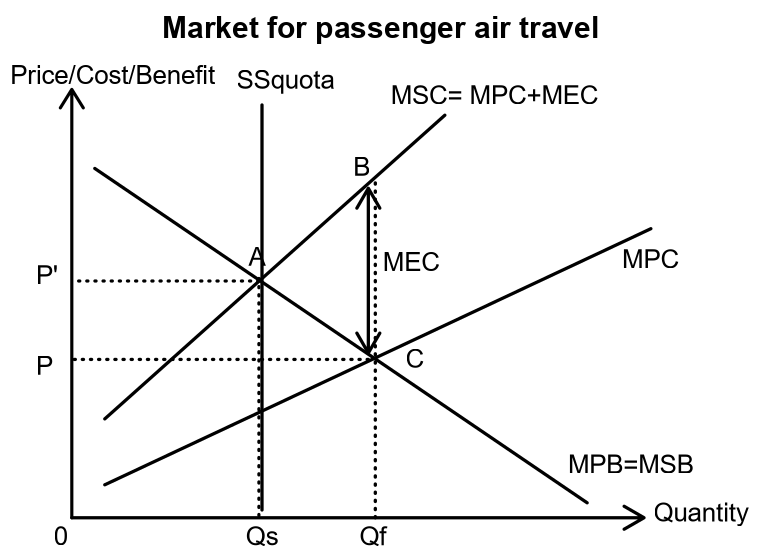
As shown in Figure 18 above, the quota fixes the quantity of air travel at Qs (SSquota). Quantity falls from Qf to Qs, so the deadweight loss of area ABC is removed. The price of air travel rises from P to P'. The quota gives certainty about the level of flying, and so about emissions.
(c) Alternative fuels and new technology. Extract 6 says "alternative fuels and new technology have the potential to bring down passenger air travel emissions". The government can fund research into sustainable aviation fuel and more fuel-efficient aircraft, such as the fuel-efficient Airbus planes in Extract 4.
Figure 19: Cleaner fuel and technology reducing the MEC
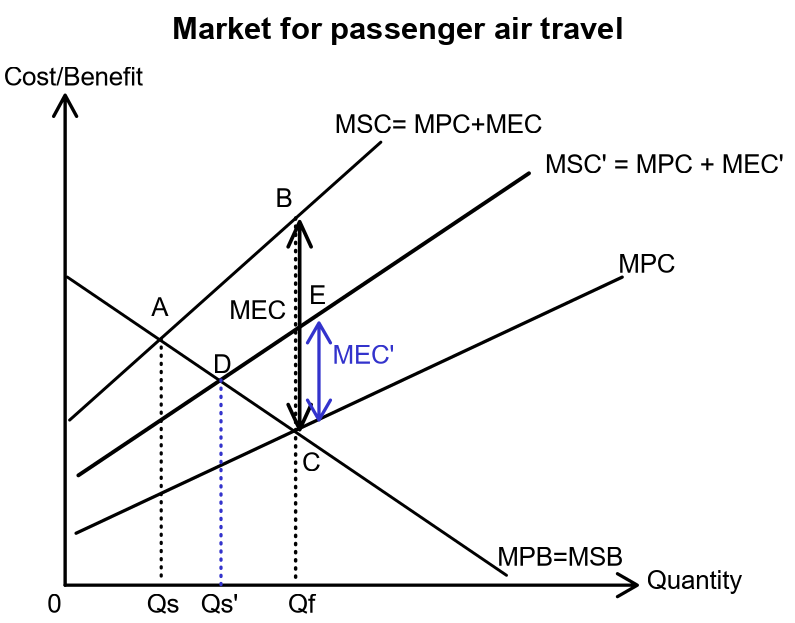
As shown in Figure 19 above, each flight now releases less CO2, so the MEC falls to MEC' and the MSC falls to MSC' = MPC + MEC'. The social optimum rises from Qs to Qs', and the deadweight loss falls from area ABC to area DEC. This policy lets people keep flying while cutting the harm from each flight.
Ev2: However, each of these policies has limitations.
The MEC of CO2 is hard to measure, since the harm is spread across the world and into the future, so the government may set the tax or quota at the wrong level. Demand for some air travel, such as business trips and long-haul flights, is price inelastic, so a very high tax is needed to cut flying. A tax also hurts low-income travellers who rely on low-cost airlines, and a quota limiting each person's flights is hard to enforce and unpopular. If one country acts alone, passengers may fly from a neighbour's airport instead, especially with so many new airports in Asia (Extract 5). Alternative fuels and new technology are "long-term solutions" (Extract 6), so they do little to reduce emissions now.
Conclusion. Subsidising alternative transport is appropriate, but it is not the most appropriate policy on its own. It works well for domestic routes where high-speed trains are a close substitute, and it is popular with voters. However, it cannot reach long-haul international flights, which have no substitute. A tax on air passengers is the most appropriate policy in the short run. It applies to all flights, internalises the externality directly, and its revenue can fund the train subsidies. In the long run, alternative fuels and new technology are needed, because Asia's demand for air travel is growing fast (Extract 5) and will keep rising. The best approach is a combination: tax flying, use the revenue to subsidise trains, and fund cleaner fuels. Since climate change is a global problem and "time is running out" (Extract 6), governments should agree on these policies together, so that passengers cannot avoid them by flying from another country.
How marks are awarded for 2(f)
This is a 10-mark question: 7 marks for analysis (R0, R1 and R2) and 3 marks for evaluation (Ev1, Ev2 and the conclusion).
| Paragraph | Analytical | Cursory | Knowledge |
|---|---|---|---|
| R0: market failure (up to 2) | Full SADSPOUT explanation of the negative consumption externality, with diagram and Extract 6 evidence (3% of CO2, fastest-growing). | Explains the externality, but misses the divergence or deadweight loss. | States that flying pollutes. |
| R1: subsidy for alternatives (up to 3) | Explains the subsidy lowering the price of trains, positive XED, the fall in MPB for air travel and the smaller deadweight loss, with both diagrams. | Explains that cheaper trains reduce flying, with no XED or diagram. | States that subsidies help. |
| R2: other policies (up to 2) | Explains one other policy (tax, quota or cleaner technology) with the Extract 6 evidence for it, correcting the market failure with a diagram. One policy is enough. | Explains a policy without a diagram or the deadweight loss. | Lists policies. |
| Ev1 and Ev2 (up to 2) | Judges each policy with case evidence (no substitute for long-haul, cost and opportunity cost, MEC hard to measure, inelastic demand, long-term fuels). | Generic limits. | None. |
| Conclusion (1) | Clear stance on "most appropriate", with a criterion (type of journey, time frame) and case evidence. | A stance with weak support. | A summary with no stance. |
You will lose marks if you argue that the subsidy lowers the price of air travel. The subsidy is given to the substitute, so it works through XED and a fall in the demand for air travel.
Practise with StudySzn
Our guides and heat maps are free to use without an account.
Enrolled students get course notes, assignments and teacher feedback through their student account. Creating an account does not unlock enrolled course materials.
Student login →